
Embark on a transformative journey into the world of data science with our expertise in leveraging R, the powerful programming language. Dive deep into the intricacies of statistical methods and analysis as we guide you through optimal solutions using R for data science challenges.
Question 1: Investigating Income Distribution in Chicago
a. Describing the Sample Data Distribution
Question: A study investigates the distribution of annual income for heads of households living in public housing in Chicago. For a random sample of size 30, the annual incomes (in thousands of dollars) are in the Chicago data file.
Based on a descriptive graphic, describe the shape of the sample data distribution. Find and interpret point estimates of the population mean and standard deviation.
Answer:
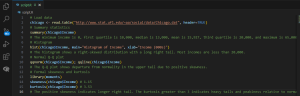
The data appears skewed right with most incomes less than 20,000. The mean income is 15,927 and the standard deviation is 7,991.
b. Constructing a 95% Confidence Interval
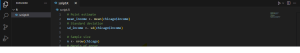
Question: Construct a 95% confidence interval for μ, using R software.
Answer:
Click here to view the complete answer
Question 2: Analyzing Cognitive Behavioral Therapy Data
a. Descriptive Statistical Analysis
Question: The Anorexia data file contains results for cognitive behavioral and family therapies and the control group. Using data for the 17 girls who received family therapy, conduct a descriptive statistical analysis using graphs and numerical summaries.
Answer:
Click here to view the complete answer
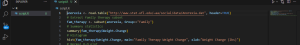
b. Constructing a 95% Confidence Interval for Weight Changes
Question: Construct a 95% confidence interval for the difference between the population mean weight changes for family therapy and the control.
Answer:
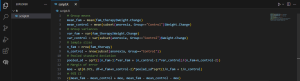
The 95% CI for difference in mean weight change is (0.90, 11.27) lbs. We can conclude the family therapy leads to greater average weight gain compared to the control group.
Feel free to use these solutions as a starting point and explore more on our website for in-depth guidance on any data science assignment help. If you have additional questions, our expert support is just a click away!
R for Data Science Step-by-Step Tutorials
Ready for some hands-on action? I’ve added step-by-step tutorials to guide you through common data science tasks using R. Follow along, and let’s conquer each step together!
Navigating Bumps in the Road: Error Handling and Debugging Tips
We all face coding hiccups. I’ve got your back with insights on common errors and practical tips for debugging R code. Learn the ropes of troubleshooting, and coding challenges won’t stand a chance.
R vs. The World: A Quick Comparison
Ever wondered how R stacks up against other data science tools? I’ve included a brief comparison to showcase R’s unique strengths and when it shines brightest. It’s your compass for choosing the right tool for the job.
From Boardrooms to Labs: Industry Relevance of R
Let’s explore how R is making waves across industries. Discover its impact in finance, healthcare, marketing, and beyond. Real-world examples will illustrate how R fuels decision-making and problem-solving.
Guest Stars in the Spotlight: Expert Contributions
Get ready for insights from industry experts! I’ve invited guest contributors to share their tips and experiences with using R for data science. Diverse perspectives to fuel your learning journey.
Hands-On Data Science: Practical Projects with R
Unleash your creativity with practical data science projects using R. Projects bring theory to life and solidify your understanding through application. Let’s turn knowledge into action!
Your Data Science Library: Curated Resources
I’ve compiled a list of external resources, from must-read books to top-notch online courses. Consider it your data science library, offering a wealth of knowledge for continuous learning of R for Data Science.
Stay Current: Updates on R Packages
Stay in the loop with the latest advancements! I’ll be sharing updates on popular R packages, ensuring you have the freshest tools for your data science toolkit.
Learning from the Pros: Real-World Case Studies
Explore real-world case studies to see how organizations leverage R for impactful data analysis and decision-making. It’s like peeking behind the curtain of data science success stories.
Happy learning!

