
In today’s data-driven world, the ability to transform raw data into actionable insights is a valuable asset. Data analysis serves as the bridge between information overload and meaningful knowledge. But how do we navigate the journey from unrefined data to clear conclusions? This blog post delves into the typical stages of a data analysis project, highlighting the key steps that unlock hidden insights within your data.
1. Defining the Problem and Setting Objectives: Charting the Course
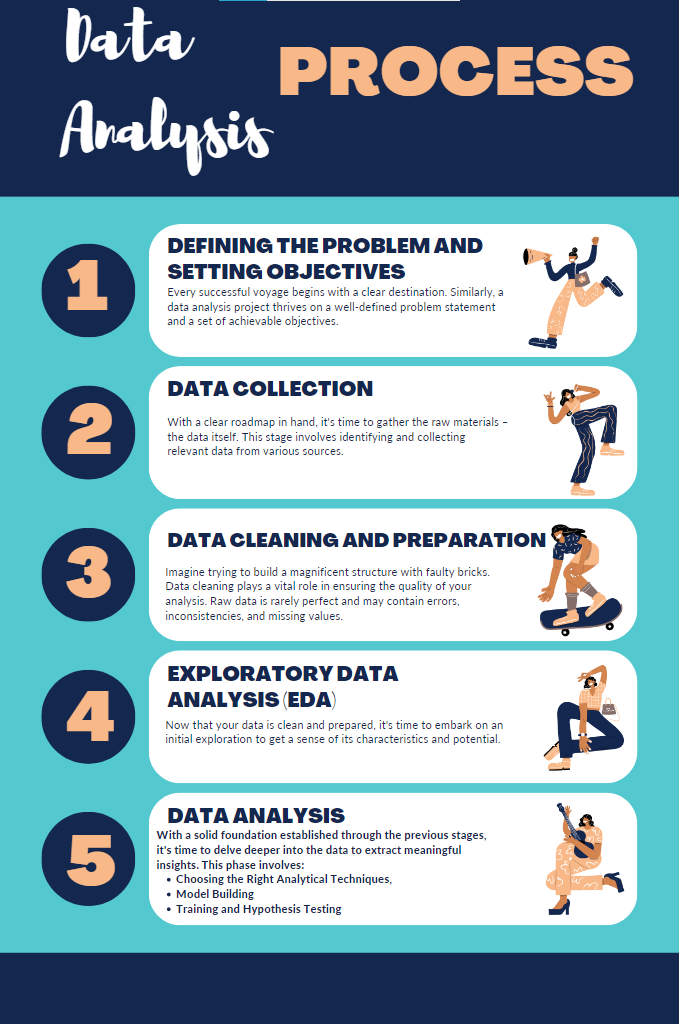
Every successful voyage begins with a clear destination. Similarly, a data analysis project thrives on a well-defined problem statement and a set of achievable objectives. Here’s what this initial stage entails:
- Identifying the Business Need: What problem are you trying to solve or what question are you aiming to answer through data analysis? Understanding the business need ensures the analysis stays focused and delivers results that are relevant to your organization’s goals.
- Formulating Specific Objectives: Once you’ve identified the problem, translate it into specific, measurable, achievable, relevant, and time-bound (SMART) objectives. These objectives act as milestones, guiding the direction of your analysis and helping you measure its success.
For example, instead of a vague objective like “improve customer satisfaction,” a SMART objective could be: “Analyze customer feedback data to identify the top 3 pain points impacting customer satisfaction and develop strategies to address them within the next quarter.”
2. Data Collection: Gathering the Raw Materials
With a clear roadmap in hand, it’s time to gather the raw materials – the data itself. This stage involves identifying and collecting relevant data from various sources:
- Internal Data Sources: Many organizations possess a wealth of data within their internal systems, such as customer relationship management (CRM) software, sales records, website analytics, and financial data.
- External Data Sources: Publicly available datasets, industry reports, and social media data can offer valuable insights, depending on your project’s objectives.
- Data Acquisition Techniques: Data collection may involve techniques like surveys, interviews, web scraping, or using APIs (Application Programming Interfaces) to access data from external sources.
It’s crucial to ensure the data you collect is relevant, accurate, and aligns with your specific objectives.
3. Data Cleaning and Preparation: Transforming the Raw Material
Imagine trying to build a magnificent structure with faulty bricks. Data cleaning plays a vital role in ensuring the quality of your analysis. Raw data is rarely perfect and may contain errors, inconsistencies, and missing values. Here’s what data cleaning involves:
- Identifying and Handling Missing Values: Missing data points can distort your analysis. Techniques like imputation (filling in missing values with estimated values) or data deletion (removing rows or columns with a high percentage of missing values) may be employed.
- Correcting Inconsistencies: Data inconsistencies, like typos or formatting errors, can lead to inaccurate results. Data cleaning involves identifying and correcting these inconsistencies.
- Transforming Data Types: Data may be stored in different formats (e.g., dates, text, numbers). Ensuring data is in the appropriate format for analysis is crucial.
- Data Validation: After cleaning, it’s essential to validate the data to ensure its accuracy and completeness.
Data cleaning is often an iterative process, requiring revisits as you delve deeper into the analysis.
4. Exploratory Data Analysis (EDA): Unveiling the Landscape
Now that your data is clean and prepared, it’s time to embark on an initial exploration to get a sense of its characteristics and potential. Exploratory Data Analysis (EDA) involves:
- Descriptive Statistics: Calculating summary statistics like mean, median, mode, standard deviation, and percentiles provides a basic understanding of the data’s central tendency and spread.
- Data Visualization: Creating visualizations like histograms, scatter plots, box plots, and heatmaps helps you identify patterns, trends, and potential outliers within the data.
- Feature Engineering: This stage may involve creating new features from existing data to improve the effectiveness of subsequent analysis.
EDA allows you to gain a deeper understanding of your data, refine your research questions, and identify areas requiring further investigation.
5. Data Analysis: Delving Deeper for Insights
With a solid foundation established through the previous stages, it’s time to delve deeper into the data to extract meaningful insights. This phase involves:
- Choosing the Right Analytical Techniques: The specific techniques used will depend on the nature of your data and the objectives you defined earlier. Techniques may include statistical modeling, hypothesis testing, regression analysis, machine learning algorithms, or other methods.
- Model Building and Training: If using machine learning or statistical modeling, this stage involves building and training a model on your data to identify relationships between variables and make predictions.
- Hypothesis Testing: If your analysis involves testing a specific hypothesis, this stage involves applying statistical tests to determine whether the data supports or refutes your hypothesis.
Data analysis is an iterative process. As you uncover new insights, you may need to revisit previous steps, refine your analysis, or gather additional data for further exploration.
6. Data Visualization: Transforming Insights into a Clear Story
Raw numbers and complex statistical models can be overwhelming for a non-technical audience. Data visualization plays a crucial role in translating your findings into a clear and compelling story. Here’s what effective data visualization entails:
- Choosing the Right Charts and Graphs: Different chart types are suited for conveying different types of information. Bar charts for comparisons, line charts for trends, scatter plots for relationships, and pie charts for proportions are some common choices.
- Clarity and Conciseness: Effective data visualizations are clear, concise, and easy to understand. Avoid cluttered visuals and ensure the message is evident at a glance.
- Data Storytelling: Use data visualizations to tell a compelling story that aligns with your objectives. Highlight key findings, trends, and insights that resonate with your audience.
Data visualization allows you to effectively communicate your findings to a broader audience, influencing decisions and driving action.
7. Interpretation and Communication: Sharing the Knowledge
Data analysis doesn’t end with generating insights. The final stage involves effectively communicating your findings to relevant stakeholders. This may involve:
- Creating Reports and Presentations: Tailor your reports and presentations to your audience’s technical background. Use clear language, compelling visuals, and actionable recommendations.
- Data Storytelling: Reiterate your data story, highlighting key insights and their implications for decision-making.
- Addressing Questions and Concerns: Be prepared to answer questions and address potential concerns your audience may have regarding the analysis and its conclusions.
Effective communication ensures your data-driven insights are understood, valued, and acted upon within your organization.
8. Evaluation and Iteration: Continuous Learning and Improvement
Data analysis is rarely a linear process. As you delve deeper and gain new insights, you may need to revisit previous steps. Evaluation involves:
- Assessing the Effectiveness of Your Analysis: Did your analysis achieve the objectives you set out to accomplish? Were the insights valuable and actionable?
- Identifying Potential Biases: Data analysis is not immune to bias. Evaluate your approach and identify potential biases that may have influenced the results.
- Considering Further Exploration: New insights may lead to new questions. Be prepared to iterate on your analysis, gather additional data, or refine your methods for further exploration.
The data analysis process is a continuous cycle of learning and improvement. By constantly evaluating and refining your approach, you can ensure your data analysis projects consistently deliver valuable insights that drive positive outcomes.
Conclusion: Transforming Data into Actionable Knowledge
The data analysis process empowers you to transform raw data into actionable knowledge. By following these well-defined stages, you can unlock hidden patterns, identify trends, and extract valuable insights that inform effective decision-making. As you gain experience and proficiency in data analysis, you’ll become a valuable asset in a world increasingly driven by data.
So, the next time you encounter a mountain of data, remember – meaningful insights lie just beneath the surface, waiting to be discovered through the power of data analysis. Take the first step today and embark on your journey to transform data into knowledge!

